🫎 Provisioning ELK-Stack using Podman
You may have already seen my previous post about podman, right? It is a super lightweight container engine that is basically docker without a service daemon, which makes it like 10x faster than alts like docker or rancher. Also, podman is used frequently in kubernetes (k8s). I have now decided to use podman now for more serious things and see how far it can go. In this post, I therefore wan’t to outline the steps needed to provision a fully fledged ELK-Stack using Podman. ELK-Stack is a common techstack used in many SOC-Teams around the globe. It has very good capabilities to function as a modular SIEM. For the sake of beeing, I have decided to not use logstash, since we do not ingress any logs yet. The stack will consist just of ElasticSearch and Kibana.
First of all, make sure you have Podman installed. Next, you will want to create a dedicated vNet for our elastic stack. For now we will name it elastic. The vNet will be the network for elasticsearch as well as for kibana. You can create the vNet like so:
podman network create elastic
Next we need to create the container volume for persistent data storage, which is required by elasticsearch. This is the command for this:
podman volume create elasticsearch-data
Now we can start to spin up the container for elasticsearch using the default image from elastic.co. Also we will expose ports 9200 and 9300 which are used by ELK internally. We also tell podman to configure it as a single-nod e cluster. Obviously, in prod you will run it in a multi-node cluster with at least 2 seed-nodes to be somewhat stable. We also pass different flags to enable internal security/authentication using a given password. We also link the previously created data volume to this container.
podman run -d \
  --name elasticsearch \
  --net elastic \
  -p 9200:9200 \
  -p 9300:9300 \
  -e "discovery.type=single-node" \
  -e "xpack.security.enabled=true" \
  -e "ELASTIC_PASSWORD=yourpassword" \
  -e "ES_JAVA_OPTS=-Xms512m -Xmx512m" \
  -v elasticsearch-data:/usr/share/elasticsearch/data \
  docker.elastic.co/elasticsearch/elasticsearch:8.12.0
Perfect. If everything has been executed as it should, we can continue now to retrieving the kibana autentication token from the elasticsearch container. We will need this token later for kibana so it can communicate properly to the rest of the ELK stack.
podman exec -it elasticsearch bash
bin/elasticsearch-service-tokens create elastic/kibana kibana-token
After you ran these commands, it will print the kibana authentication token for you. It will likely start with AA and then some hash. It is very important, that you save this token, since we will need it in the next steps.
You can now exit the container session using the command exit. We can proceed with configuring the kibana container. We give it access to the vNet, expose ports 5601 and set the elasticsearch host URL. The next flag is the kibana authentication token that you saved from the previous step. Insert it here. Then we pass the local server host and the data volume as two different flags.
podman stop kibana

podman run -d \
  --name kibana \
  --net elastic \
  -p 5601:5601 \
  -e "ELASTICSEARCH_HOSTS=http://elasticsearch:9200" \
  -e "ELASTICSEARCH_SERVICEACCOUNTTOKEN=YOUR_TOKEN_FROM_STEP_2" \
  -e "SERVER_HOST=0.0.0.0" \
  -v kibana-data:/usr/share/kibana/data \
  docker.elastic.co/kibana/kibana:8.12.0
To verify if all containers are running properly, you can execute following command:
podman ps
It will show a status list of all containers. To verify the availability of the elasticsearch API, we can perform an authenticated GET request using curl directly on the related container. It will show you basic cluster health.
podman exec elasticsearch curl -u elastic:yourpassword http://localhost:9200
If you want to troubleshoot or monitor the logs for kibana you can do this by parsing the kibana logs directly using podman and following command. If find only INFO events and no ERROR events then you are good to go.
podman logs kibana
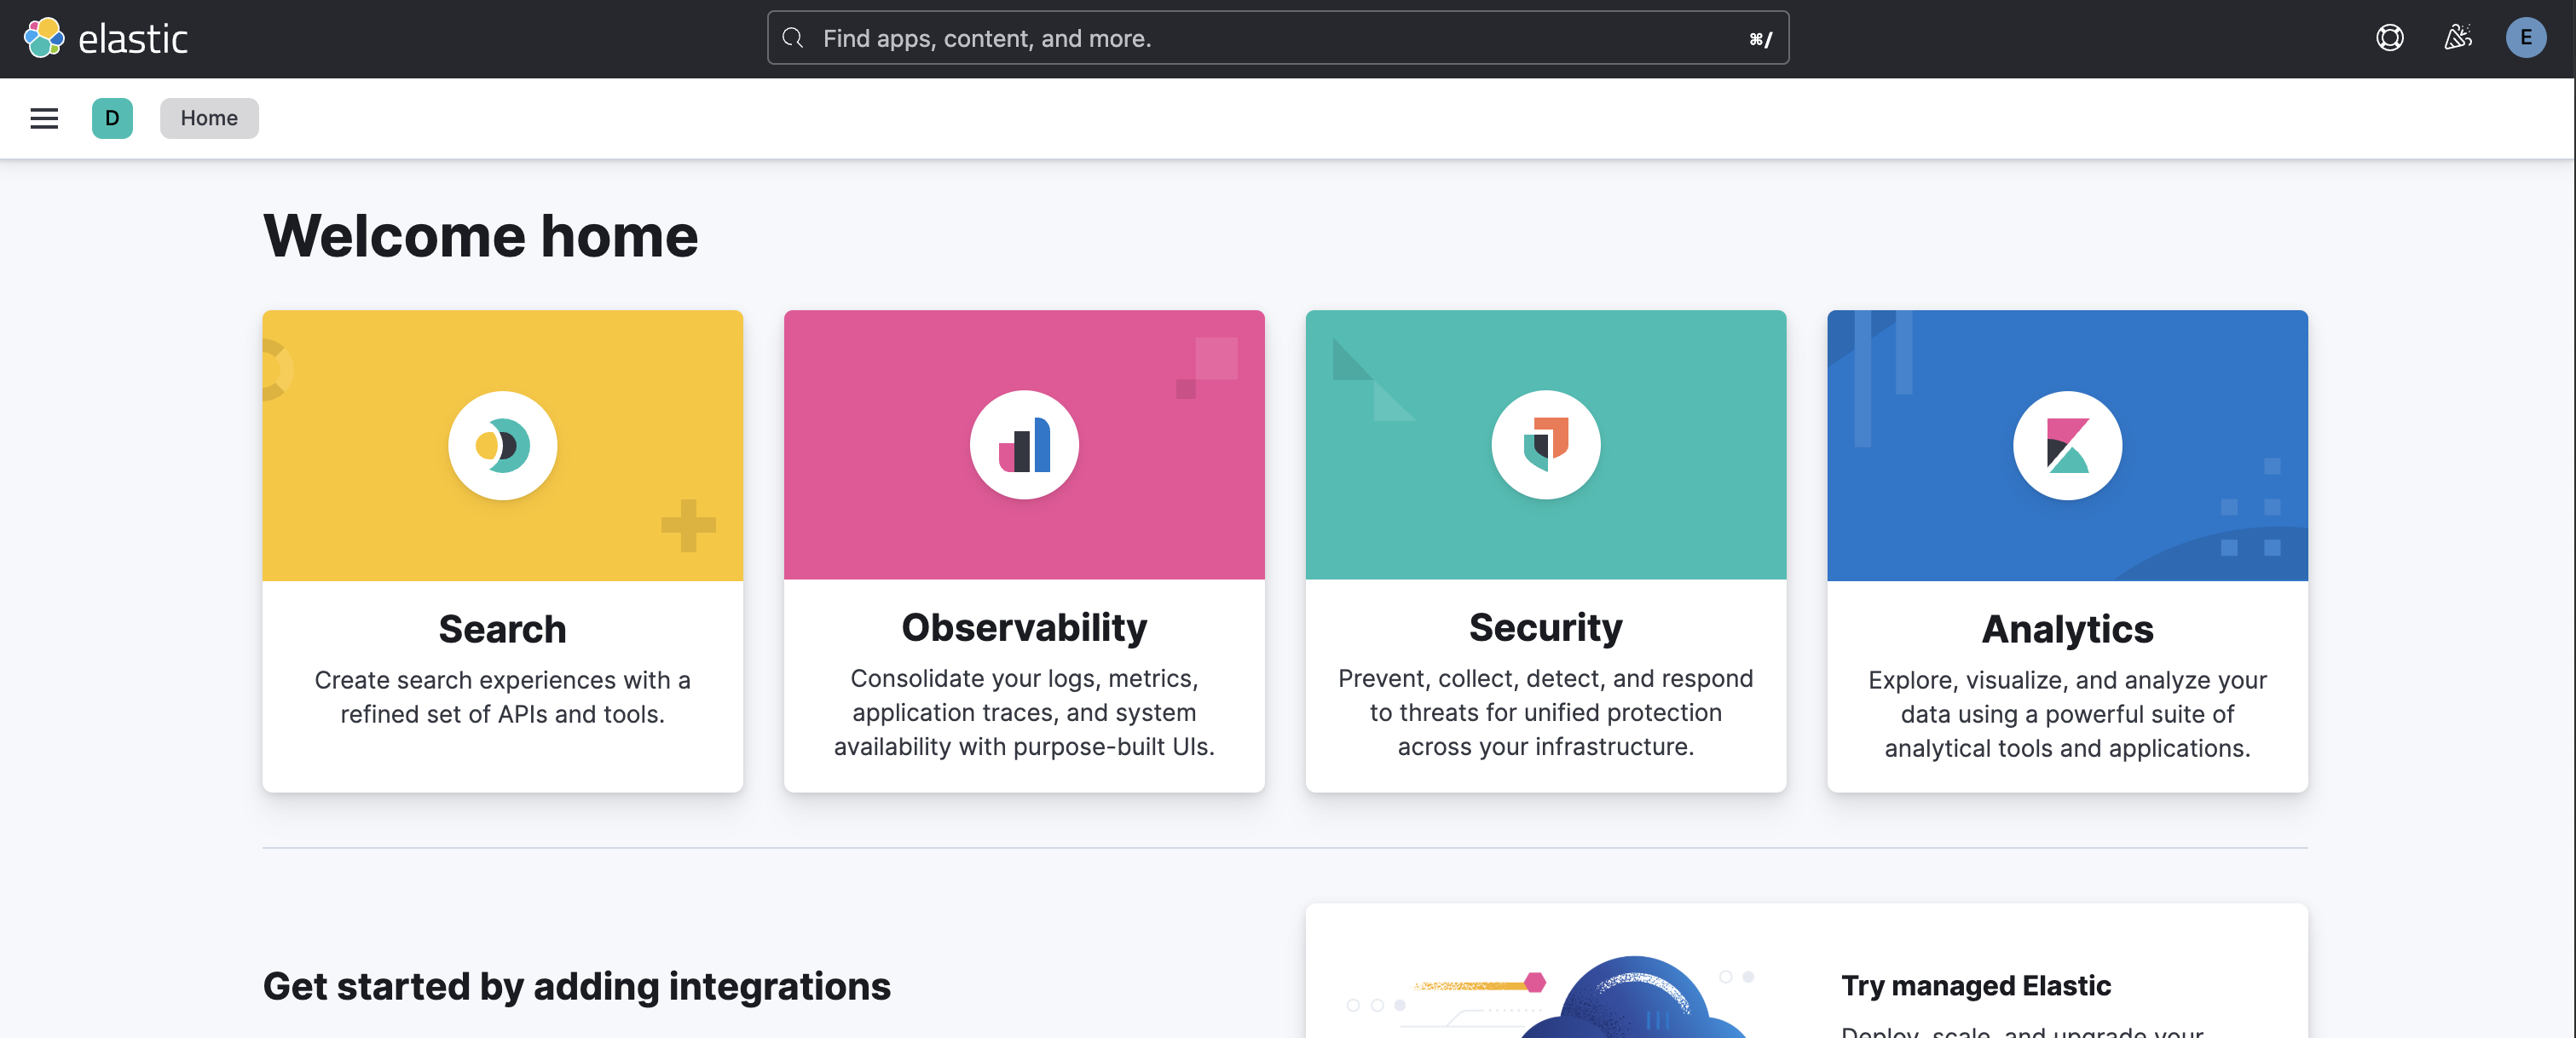
Allrighty… you are pretty much almost done. You can now test by accessing the kibana web interface which should be exposed to your host machine on port 5601 or via this url: http://localhost:5601
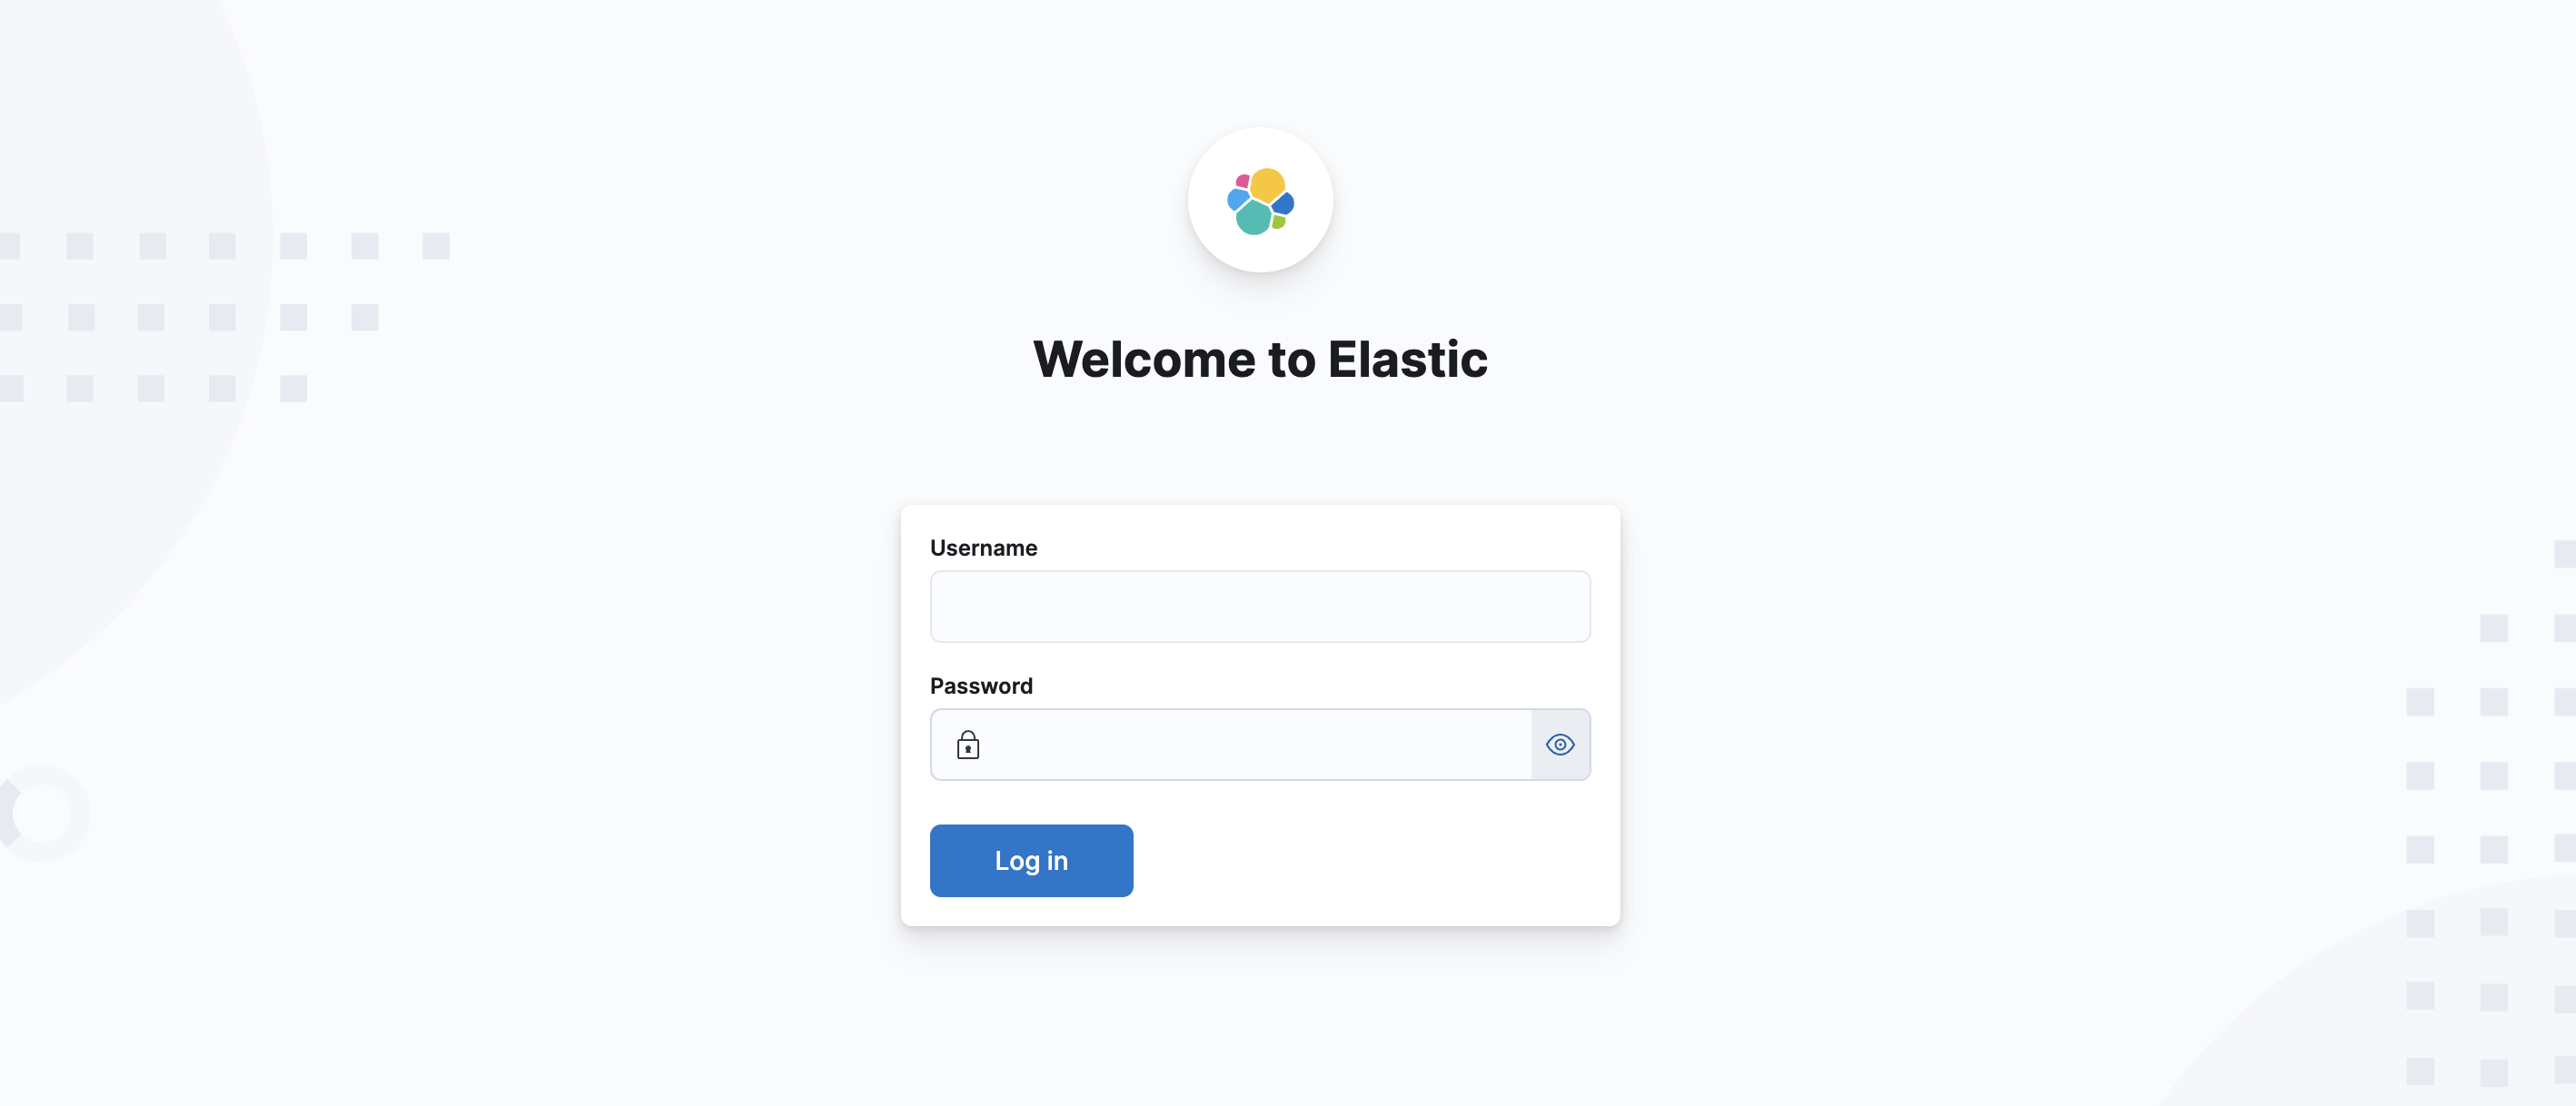
If you authenticate with the previously defined credentials, we will see the dashboard which indicates, that we have successfully provisioned ELK-stack on a single-node cluster on podman. Chapeau! 🎩